-
There seems to be an uptick in Political comments in recent months. Those of us who are long time members of the site know that Political and Religious content has been banned for years. Nothing has changed. Please leave all political and religious comments out of the forums.
If you recently joined the forums you were not presented with this restriction in the terms of service. This was due to a conversion error when we went from vBulletin to Xenforo. We have updated our terms of service to reflect these corrections.
Please note any post refering to a politician will be considered political even if it is intended to be humor. Our experience is these topics have a way of dividing the forums and causing deep resentment among members. It is a poison to the community. We appreciate compliance with the rules.
The Staff of SOH
You should upgrade or use an alternative browser.
Is there a program that will graph CPU/GPU usage?
- Thread starter jmig
- Start date
Hollister56
Members +

NZXT CAM | Free PC Monitoring and Configuration Software
I use this and like it. but it might not do what you are looking for?
would work with AMD CPU's and GPU's. It comes with all sorts of bells and whistles (overclock, undervolt, set fan curves, etc.), but I only use the
monitoring portion
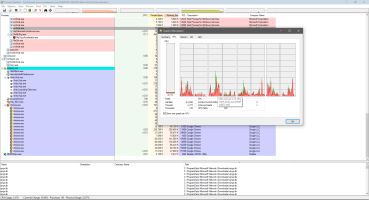
You can always just use all the graphs under the Performance tab in the task manager (although I've always found them a bit hard hard to read). Like
Afterburner, if you want a continuous graph, you'll need to leave the task manager running in the background,
Navy Chief
Senior Member
bitsum.com

Current version say Lose-er 11 only but boots on my Lose 10 fine but I'm sticking with V16.26

Process Explorer - Sysinternals
Internet Archive v17.0 for Lose 8.1 and higher.

Process Explorer - Windows Sysinternals
Internet Archive v16.21 for Vista and later.

Process Explorer

TechPowerUp

CPU-Z 2.17 Download
jmig
SOH-CM-2025
I was concerned with this GPU temp. I have added fans that will bring in cool outside air and exhaust the hot air. They are noisy but adjustable. I am trying to find a happy medium.
The fact that it jumps to 80-85°C is normal, and actually not in the danger zone at all. The danger zone starts at about 95°C sustained. But the CPU will shut down the whole system automatically when it decides it's had enough.Thank you, guys for your help. I have a quick question. What is the "Hot Spot"? It is normally around 40-50 degrees C. When I start MSFS 2024 it jumps to 80-85 degrees C and then it comes down to the 40-50 degrees C.
I was concerned with this GPU temp. I have added fans that will bring in cool outside air and exhaust the hot air. They are noisy but adjustable. I am trying to find a happy medium.
Nowadays it's almost impossible to burn a (non-overclocked) system like it was in the old days.
Oh, and AMD systems are a lot better at handling high temps than Intel. Look at my signature, I'm biaised!
Jan
